I use NodeJS for a lot of different things. It’s my go to for creating a robust API, simple automation, or any number of tasks. But debugging Node applications can be tricky, tedious, and slow. Applications become littered with console.log()‘s everywhere. Chrome’s Developer Tools provide an amazing set of resources to interact with our code in a procedural way using breakpoints. Here I’ll walk through setting up Node and Chrome Dev Tools to work together to make debugging your Node app a breeze.
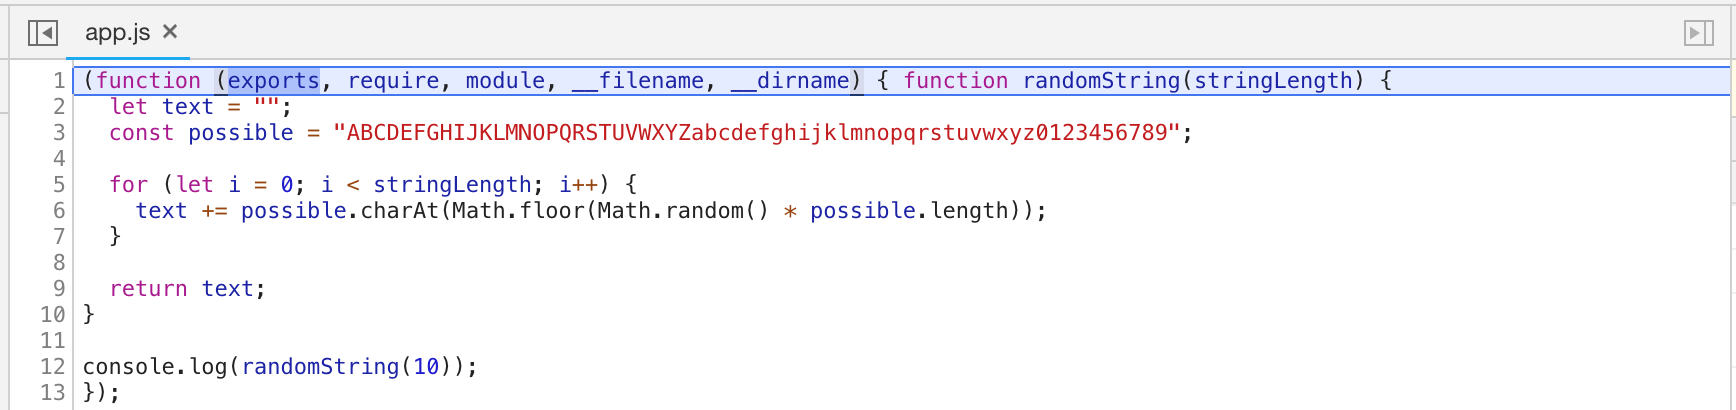
First, we’ll create a simple NodeJS application to use. This simply generates a random string.
app.js1
2
3
4
5
6
7
8
9
10
11
12function randomString(stringLength){
let text = "";
const possible = "ABCDEFGHIJKLMNOPQRSTUVWXYZabcdefghijklmnopqrstuvwxyz0123456789";
for (let i = 0; i < stringLength; i++){
text += possible.charAt(Math.floor(Math.random() * possible.length));
}
return text;
}
console.log(randomString(10));
Next we need to start Node and pass the inspect flag to tell Node that we want to use the Chrome Dev Tools.
1 | node --inspect-brk app.js |
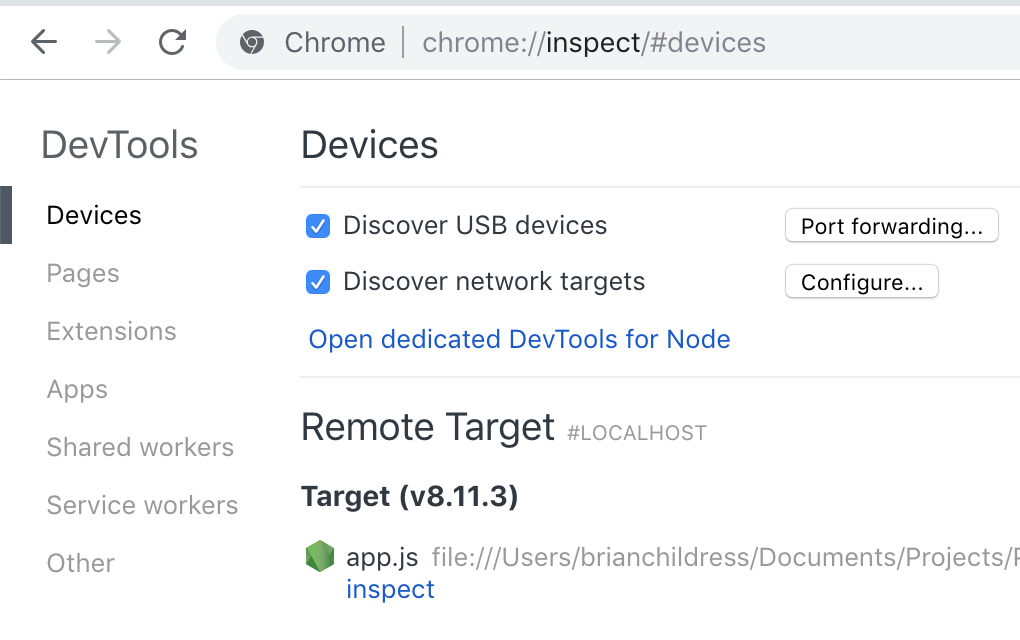
Now let’s open a new tab in Chrome and navigate to chrome://inspect. This will show our running application in inspect mode.
By adding the brk flag the inspector will always start on the first line of the application.
Now we can set breakpoints, inspect variables, modify variables, etc. all of the great things we’re accustomed to using in through Chromes Dev Tools.
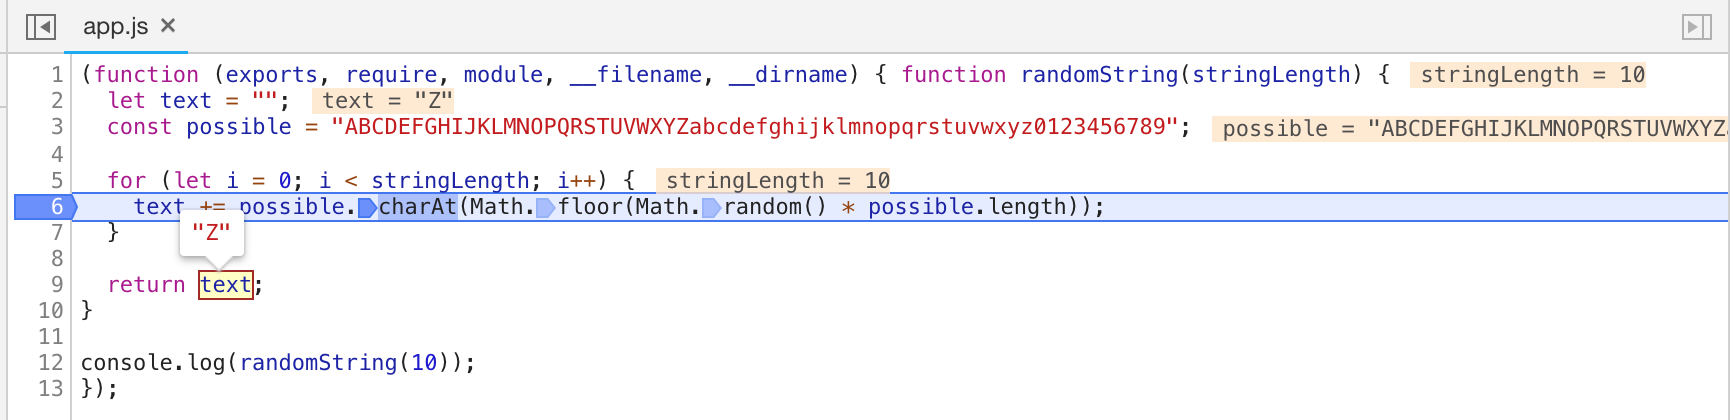
We can also search for other files in our application by hitting cmd + p on Mac.
Using Debug inside a Docker Container
Using the Node inspector inside of a Docker container can be a little trickier. By default the host port for the inspector is our normal localhost, 127.0.0.1. We need to remap that IP to something accessible from outside of the running Docker Container by adding =0.0.0.0 to our inspect flag.
1 | node --inspect-brk=0.0.0.0 app.js |
With the NodeJS inspector available in Chrome’s Dev Tools we can improve our debugging by reducing the time it takes to identify what’s happening in our applications.